Visualise Texts
Tech Tools: Wordle, Tagxedo or The New York Times Visualization Lab
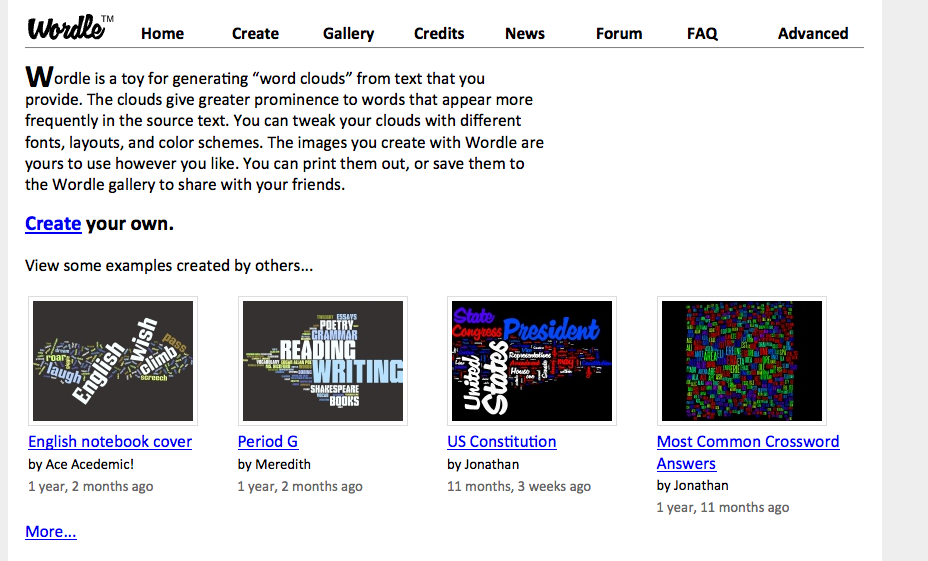
Wordle is a fun tool for playing with language and making meaning from texts. (And it’s quite safe for classroom use.)
This self-described “toy” allows students to analyze word frequency in any text, from a poem to a science book chapter, by simply copying and pasting “a bunch of text” into the box on the top of this page. Click on “go” and you’ll get a snapshot of the most common words in that text as shown by size. (The most frequently appearing words appear larger.)
For example, looking at a word cloud for Act 1, Scene 5 of Shakespeare’s “Hamlet” might illuminate the major characters, themes and issues of that part of the play, and/or the writer’s style and diction. And Wordle can be used for expository and nonfiction texts too (even crossword puzzles!).
Visualizations of New York Times articles can help highlight key vocabulary, content and concepts. For instance, students could create a Wordle using three articles on the recession to try to identify key terms they should learn more about.
Examining word clouds can not only provide new vantage points for literary and language scholars, but also help English-language learners, and others who have trouble with complex texts, to see patterns.
Students can play with the font and colors and make as well as save and reuse “Wordles” of their own, so the possibilities are endless. They can use their own writing to see what words they overuse, perhaps, or create Wordle versions of a famous poem, speech or song that visually reflects the way the text “feels” to them.
The Times has created some fascinating word clouds to help readers gain a visual understanding of current events. See, for example, the word cloud from the 2008 presidential election compares speeches made at the Republican and Democratic National Conventions, and the interactive “word train” that let people submit the words that best described their state of mind on Election Day.
The New York Times Visualization Lab – an offshoot of I.B.M.’s project Many Eyes – allows readers to explore visualize text, values, maps, data points and parts of a whole in any Times article as well as some public records, like the Consumer Price Index.
More adventurous users might explore Tagxedo, where you can create word clouds in the shape of an object.

No comments yet.